- SEO metrics are the data points that tell you whether your SEO strategy is working or silently failing
- Tracking the wrong metrics wastes months of effort on numbers that never translate into real business results
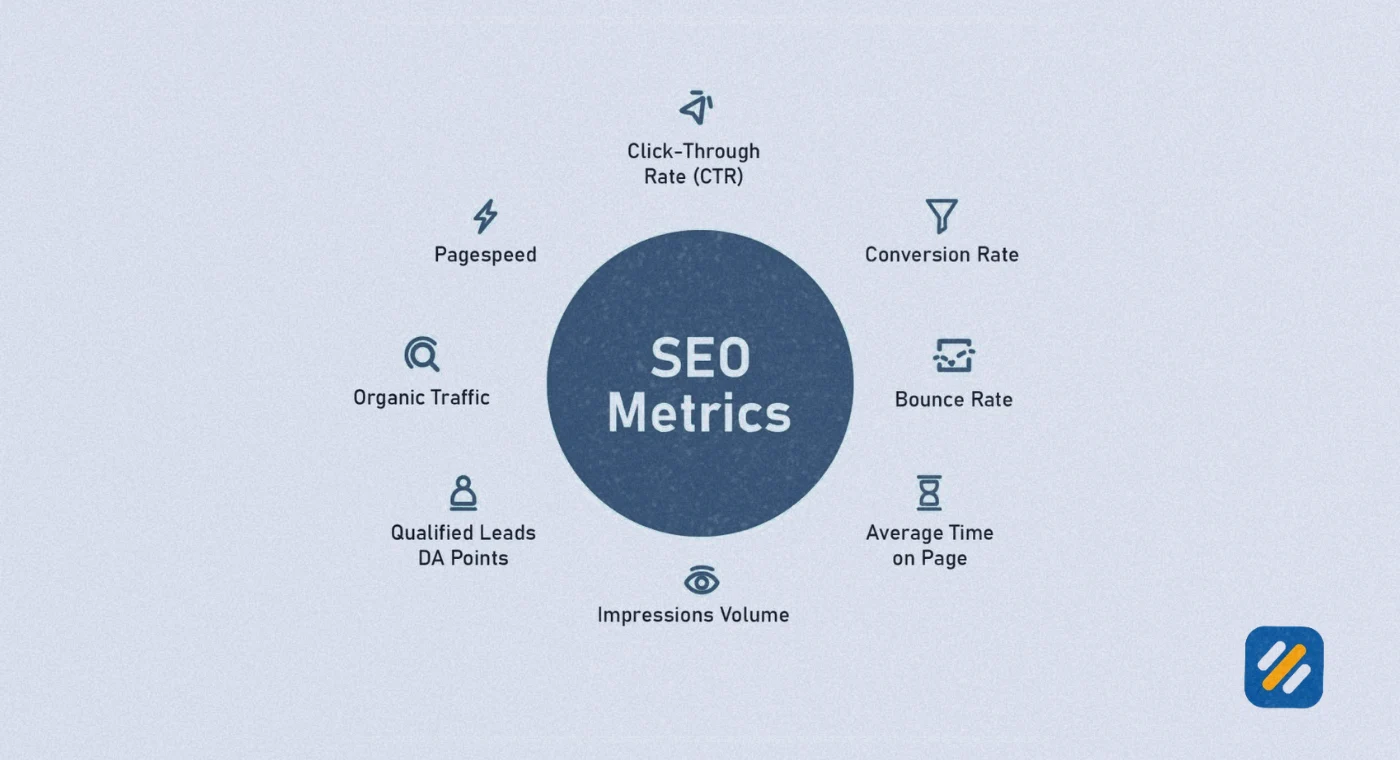
- The most important SEO performance metrics are organic traffic, keyword rankings, CTR, Core Web Vitals, backlinks, and referring domains
- Google Search Console and Google Analytics 4 give you the majority of what you need for free
- A single metric never tells the full story. The real insight comes from tracking multiple SEO KPIs together and understanding how they connect
1 What Are SEO Metrics and Why Most Beginners Track the Wrong Ones
Six years of doing SEO for real clients has taught me one uncomfortable truth about this industry. Most websites that fail at SEO do not fail because of bad content or poor optimisation. They fail because nobody was watching the right numbers.
SEO metrics are the measurable data points that tell you how your website is performing in search engines. They answer three fundamental questions. Is Google finding and indexing your pages? Are those pages ranking for the right keywords? And are those rankings actually bringing real visitors who take real actions?
The problem is that beginners tend to obsess over vanity metrics. They celebrate when a single keyword jumps from position 8 to position 6 without checking whether that keyword was driving any traffic in the first place. They watch their domain authority number climb while their organic traffic flatlines. They track total backlinks instead of referring domains and miss the far more meaningful signal entirely.
This guide covers every SEO performance metric that actually matters, what each one tells you, how to measure it, and how to improve it. By the end you will know exactly which numbers to watch each week and what to do when those numbers move in the wrong direction.
2 What Is SEO and How Do Metrics Fit Into the Bigger Picture
Before diving into individual metrics, understanding how SEO metrics connect to actual business outcomes is essential. This is the piece most guides skip entirely.
SEO is the process of improving your website's visibility in unpaid search engine results. Every action you take in SEO, whether publishing content, building backlinks, or improving site speed, either moves one of your SEO metrics in a positive direction or it does not. Metrics are how you know which actions are working.
Think of SEO metrics as three layers of measurement
Layer 1: Visibility Metrics tell you whether Google can find and show your website. Indexed pages, crawl errors, search impressions, and keyword rankings all live here.
Layer 2: Traffic Metrics tell you whether people are actually clicking through to your website from search results. Organic traffic, click through rate, and search visibility are the primary metrics in this layer.
Layer 3: Business Metrics tell you whether that traffic is delivering real value. Organic conversions, SEO conversion rate, SEO ROI, and engagement rate all live in this layer.
Most beginners only track Layer 1 and Layer 2. The businesses that win at SEO long term are the ones that connect all three layers and understand how a change in keyword rankings eventually impacts revenue.
3 The 15 Most Important SEO Metrics You Need to Track
Here is every SEO metric that matters, what it measures, where to find it, and what a healthy benchmark looks like:
| SEO Metric | What It Measures | Where to Find It | Healthy Benchmark |
|---|---|---|---|
| Organic Traffic | Visitors from unpaid search results | Google Analytics 4 | Consistent month on month growth |
| Keyword Rankings | Position in search results for target keywords | Google Search Console, Ahrefs | Top 10 for primary keywords |
| Click Through Rate (CTR) | Percentage of impressions that result in clicks | Google Search Console | 3 to 5% average across all pages |
| Search Impressions | How many times your pages appear in search results | Google Search Console | Growing over time |
| Core Web Vitals | Page speed and user experience scores | Google Search Console, PageSpeed Insights | All metrics in green |
| Referring Domains | Number of unique websites linking to you | Ahrefs, SEMrush | Steady monthly growth |
| Backlinks | Total number of inbound links | Ahrefs, Google Search Console | Quality over quantity |
| Domain Authority | Overall site authority score | Ahrefs (DR), Moz (DA) | Above 30 for competitive niches |
| Bounce Rate | Percentage of visitors who leave after one page | Google Analytics 4 | Under 60% for content sites |
| Engagement Rate | Percentage of sessions with meaningful interaction | Google Analytics 4 | Above 40% |
| Indexed Pages | Number of pages Google has indexed | Google Search Console | Matches pages you want indexed |
| Organic Conversions | Actions taken by organic visitors | Google Analytics 4 Goals | Industry dependent |
| SEO Conversion Rate | Percentage of organic visitors who convert | Google Analytics 4 | 2 to 5% for most industries |
| SEO ROI | Return on investment from SEO spend | SEMrush Traffic Cost estimate | Positive by month 12 |
| Crawl Errors | Technical issues blocking Google from your pages | Google Search Console | Zero critical errors |
4 Organic Traffic | The North Star SEO Metric
Organic traffic is the number of visitors who arrive at your website by clicking an unpaid search result on Google, Bing, or any other search engine. It is the most fundamental measure of whether your SEO is working.
Everything else in SEO, every title tag you optimise, every backlink you earn, every technical fix you implement, ultimately exists to move this number upward. If organic traffic is growing consistently, your SEO is working. If it is flat or declining despite effort, something in your strategy needs to change.
Where to find it: Google Analytics 4 under Reports, then Acquisition, then Traffic Acquisition. Filter by "Organic Search" in the session default channel group column.
What to look for: You want to see consistent month over month growth. A new website will have near zero organic traffic for the first two to three months. This is normal. The first meaningful growth typically appears between months three and six when Google has had time to assess your content quality and start ranking your pages for lower competition queries.
What damages organic traffic most frequently
- A Google algorithm update that penalised thin or low quality content
- Technical issues blocking pages from being indexed
- Competitors publishing better content and overtaking your rankings
- Website migration that broke URLs without proper redirects in place
5 Keyword Rankings | What Position You Hold in Search Results
Keyword rankings tell you where your pages appear in Google search results for specific queries. A page ranking in position one for a keyword with 1,000 monthly searches will get far more traffic than a page ranking in position eight for a keyword with 5,000 monthly searches.
This is the metric most beginners track first and the one they misinterpret most often. A keyword ranking is only valuable in proportion to the search volume, search intent, and commercial value of that keyword. Ranking number one for a keyword nobody searches is meaningless.
Where to find it: Google Search Console shows all keywords your site ranks for under Performance, then Search Results. For a more detailed view with historical trends and competitor comparisons, Ahrefs Rank Tracker or SEMrush Position Tracking give you per-keyword data.
The ranking positions that matter most
| Position | Average CTR | Traffic Expectation |
|---|---|---|
| Position 1 | 27.6% | Highest traffic, premium position |
| Position 2 | 15.8% | Strong traffic, worth targeting |
| Position 3 | 11.0% | Good traffic, competitive range |
| Position 4 to 5 | 6 to 8% | Moderate traffic |
| Position 6 to 10 | 2 to 4% | Low traffic but page one |
| Position 11 to 20 | Under 1% | Minimal traffic, page two |
| Position 21 plus | Near zero | Effectively invisible |
The most important insight in the table above is the cliff between page one and page two. A page sitting in position 11 or 12 is only one or two improvements away from page one traffic, yet it currently receives almost nothing. These borderline page two rankings are your highest priority optimisation targets because a small improvement produces a disproportionately large traffic gain.
6 Click Through Rate | Why Rankings Alone Are Not Enough
Click through rate is the percentage of people who see your website in Google search results and actually click on it. It is calculated by dividing total clicks by total impressions.
A page can rank in position three for a valuable keyword and still generate disappointing traffic if its title tag and meta description fail to convince searchers to click. CTR is where your SEO work and your copywriting skill intersect.
Where to find it: Google Search Console under Performance. Click on any page or keyword to see its specific CTR.
Average CTR benchmarks by position based on industry research
- Position 1: 27 to 30%
- Position 2: 14 to 16%
- Position 3: 10 to 12%
- Position 4 to 5: 6 to 8%
- Position 6 to 10: 2 to 4%
How to improve CTR without changing your ranking
Rewrite title tags to include a power word, a specific number, or a benefit statement. "SEO Metrics Guide" becomes "15 SEO Metrics Every Beginner Must Track in 2026." Test meta descriptions that address the searcher's specific pain point rather than just describing what the article contains. Add structured data to earn rich snippets, star ratings, or FAQ dropdowns that make your result stand out visually from the nine other blue links on the page.
7 Core Web Vitals | The Technical SEO Metrics Google Uses as a Ranking Signal
Core Web Vitals are a set of specific page experience metrics that Google officially confirmed as ranking signals in 2021. They measure three aspects of how users physically experience your webpage.
Largest Contentful Paint (LCP) measures how long it takes for the largest visible element on your page, usually the hero image or main heading, to fully load. Google's threshold for a good LCP score is under 2.5 seconds.
Interaction to Next Paint (INP) replaced First Input Delay in 2024 and measures how quickly your page responds when a user interacts with it, such as clicking a button or a menu. Good INP is under 200 milliseconds.
Cumulative Layout Shift (CLS) measures visual stability, specifically whether page elements move unexpectedly while loading. A good CLS score is under 0.1.
Where to find it: Google Search Console under Experience, then Core Web Vitals. Also available at PageSpeed Insights for individual URL testing.
For WordPress websites specifically, the fastest way to improve all three Core Web Vitals scores simultaneously is to install WP Rocket for caching and lazy loading, use Smush or ShortPixel for image compression, and set up Cloudflare as a free CDN to serve your content from servers geographically closer to your visitors.
8 Backlinks and Referring Domains | Understanding the Difference That Changes Everything
This is the SEO metric distinction that most beginners get wrong and it costs them months of misguided effort.
Total backlinks is the raw count of every link pointing to your website. One website can give you 50 backlinks by linking to you from 50 different pages. But in Google's eyes, each subsequent link from the same domain carries less and less weight than the first.
Referring domains is the number of unique websites linking to you. One new referring domain always carries more SEO weight than the fiftieth backlink from a domain that already links to you.
When I check a client website's link profile in Ahrefs, I filter directly to referring domains and largely ignore the total backlink count. A site with 500 backlinks from 500 different referring domains is significantly more authoritative than a site with 2,000 backlinks from only 50 domains.
Where to find it: Ahrefs Site Explorer, SEMrush Backlink Analytics, or Google Search Console under Links for a basic overview
What to focus on:
| Metric | What It Tells You | Priority Level |
|---|---|---|
| Referring Domains Growth | Whether your link building is working | High priority |
| Referring Domain Quality | Whether new links come from trusted sites | High priority |
| Total Backlinks | Overall link volume | Medium priority |
| Lost Referring Domains | Whether you are losing existing link equity | High priority |
| Anchor Text Distribution | Whether your link profile looks natural | Medium priority |
| Links to 404 Pages | Whether you are losing backlink equity to broken pages | High priority |
9 Organic Conversions and SEO Conversion Rate | The Metrics That Prove Business Value
Every SEO metric discussed so far measures something that happens before business value is created. Organic conversions and SEO conversion rate measure whether your SEO traffic actually delivers the outcomes your business exists to produce.
An organic conversion is any meaningful action taken by a visitor who arrived through organic search. For a blog this might be an email newsletter signup. For a service business it is a contact form submission or a phone call. For an ecommerce website it is a purchase.
SEO conversion rate is the percentage of organic visitors who complete one of these actions. It is calculated by dividing total organic conversions by total organic sessions and multiplying by 100.
Where to find it: Google Analytics 4 under Conversions. You must first set up conversion events in GA4 to track specific actions. This is a one time setup that takes under 30 minutes and gives you permanent visibility into whether your SEO traffic is delivering real business results.
Why this metric matters more than rankings: I have audited websites ranking on page one for competitive keywords that were generating almost no leads because the keyword intent did not match what the business actually sold. Rankings and traffic are inputs. Conversions are the output that justifies every hour and every dollar spent on SEO.
10 Domain Authority and Search Visibility | Measuring Your Overall SEO Health
Domain authority is a third party score, not a Google metric, that estimates how likely a website is to rank well in search results based primarily on its backlink profile. Moz created the original DA score out of 100. Ahrefs uses a similar metric called Domain Rating (DR).
These scores are useful as a directional indicator and for competitor comparison but they should never be treated as a direct ranking factor. Google does not use domain authority scores in its algorithm. What matters to Google is the quality and relevance of links pointing to your site, which these scores attempt to approximate.
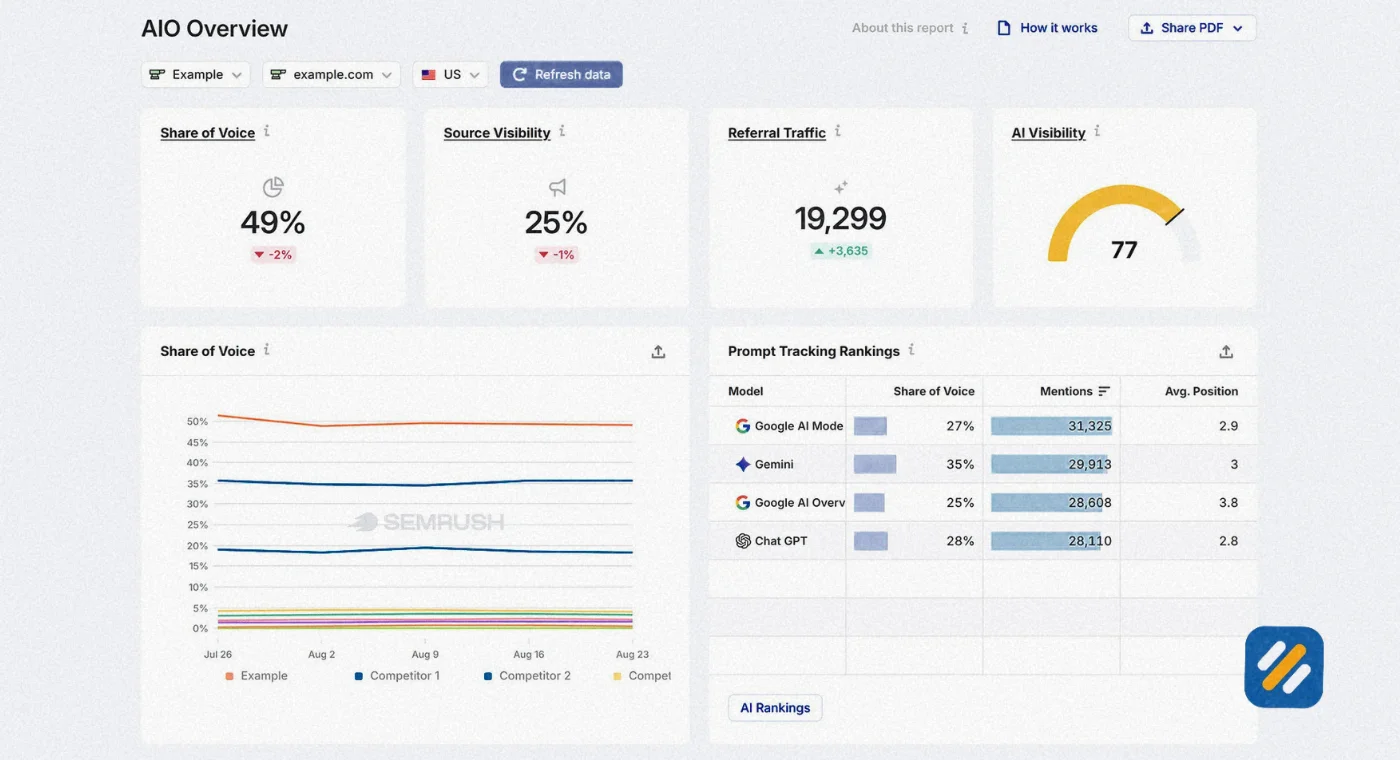
Search visibility is a metric available in SEMrush and Ahrefs that measures what percentage of all possible clicks for your tracked keywords your website is capturing. It is one of the most holistic single-number representations of your overall SEO performance.
A rising search visibility score means your pages are ranking for more keywords and capturing a larger share of available traffic. A declining score means competitors are gaining ground on your tracked keyword set and your strategy needs adjustment.
11 Engagement Rate | The GA4 Metric That Replaced Bounce Rate
Google Analytics 4 replaced the traditional bounce rate metric with engagement rate. Understanding the difference matters because the two metrics measure user behaviour in opposite directions and many beginners confuse them.
In Universal Analytics, a high bounce rate was bad. It meant users were leaving after viewing only one page.
In GA4, a high engagement rate is good. An engaged session is defined as a session lasting longer than 10 seconds, a session where a conversion event occurred, or a session with two or more pageviews.
Engagement rate is calculated by dividing engaged sessions by total sessions. A healthy engagement rate for a content website is typically above 40 to 50%.
Where to find it: Google Analytics 4 under Reports, then Acquisition, then Traffic Acquisition. The engagement rate column shows for each traffic channel.
What a low engagement rate tells you: If organic traffic has a low engagement rate it usually means one of three things. Your content is not matching the search intent that brought the user to your site. Your page loads too slowly and users leave before it finishes. Or your content answers the user's question so quickly and clearly that they leave satisfied, which is actually fine and not a problem worth solving.
12 How to Build Your SEO Metrics Tracking System Step by Step
Knowing which metrics matter is only half the job. Having a system to track them consistently is what turns data into decisions.
Here is the exact tracking setup I recommend for any website starting from scratch
Step 1: Set up Google Search Console. Verify your website, submit your sitemap, and bookmark the Performance report. This gives you keyword rankings, impressions, clicks, and CTR data directly from Google at no cost.
Step 2: Set up Google Analytics 4. Install the GA4 tracking code through your WordPress theme or Google Tag Manager. Set up at least one conversion event, such as a contact form submission or newsletter signup, so you can track SEO conversion rate from day one.
Step 3: Connect Rank Math to Google Search Console. Rank Math's free plugin pulls your GSC data directly into your WordPress dashboard so you can see keyword performance without leaving your website.
Step 4: Set up a free Ahrefs Webmaster Tools account. This gives you access to your referring domains report, your backlink profile, and any pages on your site returning errors. It is completely free for website owners and takes ten minutes to set up.
Step 5: Create a monthly reporting template. Track these seven numbers every month in a simple spreadsheet: total organic clicks from GSC, total organic sessions from GA4, average position from GSC, referring domain count from Ahrefs, Core Web Vitals status from GSC, number of indexed pages from GSC, and organic conversions from GA4.
Step 6: Review weekly, analyse monthly. Check Google Search Console every Monday for crawl errors, coverage issues, and any sudden drops in clicks or impressions. Do a deeper monthly analysis where you compare all seven tracked metrics to the previous month and identify the three highest priority actions for the coming month.
13 SEO ROI — Proving That Your SEO Investment Is Actually Worth It
SEO ROI is the hardest metric to calculate precisely and the most important one to understand directionally. It answers the question every business owner eventually asks: is the time and money I am spending on SEO actually paying off?
The most practical way to estimate SEO ROI without complex attribution modelling is to use traffic cost estimation. SEMrush and Ahrefs both provide a "traffic value" metric that estimates how much you would pay in Google Ads to receive the same volume of organic traffic you are currently getting for free.
If your website receives $5,000 worth of equivalent paid traffic per month and you are spending $1,000 per month on content creation and SEO tools, your SEO ROI is strongly positive. If you are spending more than the traffic is worth, either your keyword targeting needs to improve or you need to focus on higher commercial intent keywords that attract visitors more likely to convert.
For a personal brand SEO blog, ROI calculation includes three revenue streams: AdSense earnings from traffic volume, affiliate commissions from tool recommendations, and inbound freelance client enquiries generated by ranking for SEO-related keywords. Tracking all three separately and combining them gives you the complete picture of what your SEO investment is returning.
14 3 Expert Tips for Getting More From Your SEO Metrics
Tip 1: Compare Metrics in Pairs, Never in Isolation
A rising keyword ranking with a declining CTR tells you your meta description is weak. Rising organic traffic with a falling conversion rate tells you you are attracting the wrong intent keywords. Always look at two related metrics together because the relationship between them reveals the problem that a single metric hides.
Tip 2: Set a 90-Day Minimum Before Judging Any SEO Change
Making a change to your website and checking its impact after two weeks is like planting a seed and digging it up after three days to see if it grew. Google takes weeks to recrawl, reindex, and reassess pages after changes. Set a calendar reminder for 90 days after any significant SEO change and measure impact then, not before.
Tip 3: Prioritise Metrics Connected to Revenue Over Vanity Metrics
Domain authority, total backlinks, and social shares look impressive in reports but they do not pay salaries. Every month, before reviewing any other metric, check organic conversions and SEO conversion rate first. These are the numbers that connect your SEO work to your business results. Everything else is context that helps you improve them.
15 Conclusion
SEO metrics are not just numbers in a dashboard. They are the feedback system that tells you whether every article you publish, every backlink you earn, and every technical fix you implement is moving your website toward real business outcomes.
The websites that win at SEO long term are not the ones with the highest domain authority or the most backlinks. They are the ones whose owners understand what their metrics are telling them, know which numbers to prioritise each month, and make consistent decisions based on data rather than guesswork.
Start with Google Search Console and Google Analytics 4. Track your seven core metrics monthly in a simple spreadsheet. Focus first on organic traffic, keyword rankings, and conversion rate. Add depth to your analysis as your website grows.
The data is already waiting for you. All you need to do is start looking at it consistently.
Have a question about any of these SEO metrics or how to track them for your specific website? Drop a comment below and I will answer it personally.
Join 1,000+ business owners and bloggers who get one actionable SEO tip every week — straight to their inbox. Free forever.
Get Free Weekly Tips →